
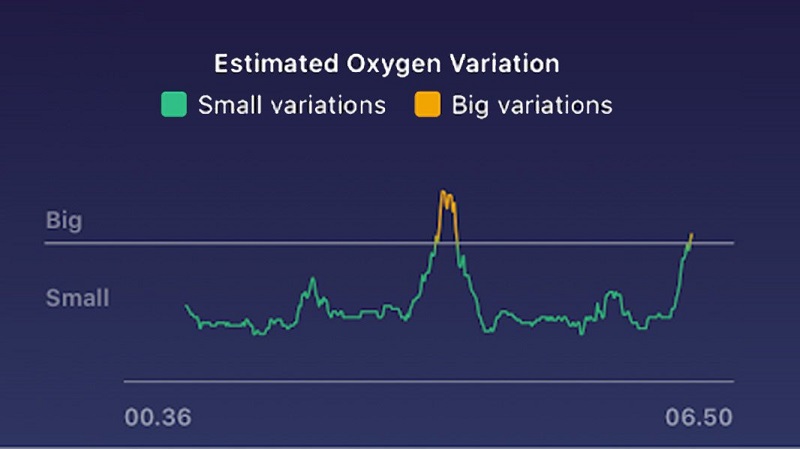
New Delhi, Feb 27 (IANS) In a bid to make its wearable devices even better at detecting abnormalities in your sleep, wearables giant Fitbit on Thursday announced its Estimated Oxygen Variation Graph, which makes use of the red and infrared sensors on the back of the wearable to estimate the variabilities in users’ blood oxygen levels, is now available for all.
“The graph, which users can see in the Fitbit app under the Sleep tile, approximates the changes in your blood oxygen saturation while you sleep. Blood oxygen saturation measures the percent of your blood that’s saturated with oxygen.
“Typically, it’s at 95-100 per cent, meaning the blood is carrying as much oxygen as it can. If you stop breathing or have other lung issues, the saturation level can fall since less oxygen enters the body. In general, variations should be low and seeing frequent, big variations could be a sign that you may be experiencing breathing disturbances during sleep,” the company said in a statement.
Many people who suffer from sleep apnea do not realise they have the condition.
According to reports, an estimated that 22 million Americans suffer from the disorder, which is actually a struggle to breathe properly while asleep.
Often it presents itself through loud, frequent snoring interspersed with sudden choking as your body tries to get enough oxygen.

 Ms Kalinga